library(vaast)
library(ggplot2)
library(dplyr)
#>
#> Attaching package: 'dplyr'
#> The following objects are masked from 'package:stats':
#>
#>     filter, lag
#> The following objects are masked from 'package:base':
#>
#>     intersect, setdiff, setequal, union

# pick examples
exampledata <- datasaurus_dozen %>%
  filter(dataset==c("v_lines", "circle", "dots", "away"))
#> Warning in dataset == c("v_lines", "circle", "dots", "away"): longer object
#> length is not a multiple of shorter object length

#plot them
exampledata %>%
  ggplot(aes(x=x,y=y, colour=dataset))+
  geom_point() +
  facet_wrap("dataset")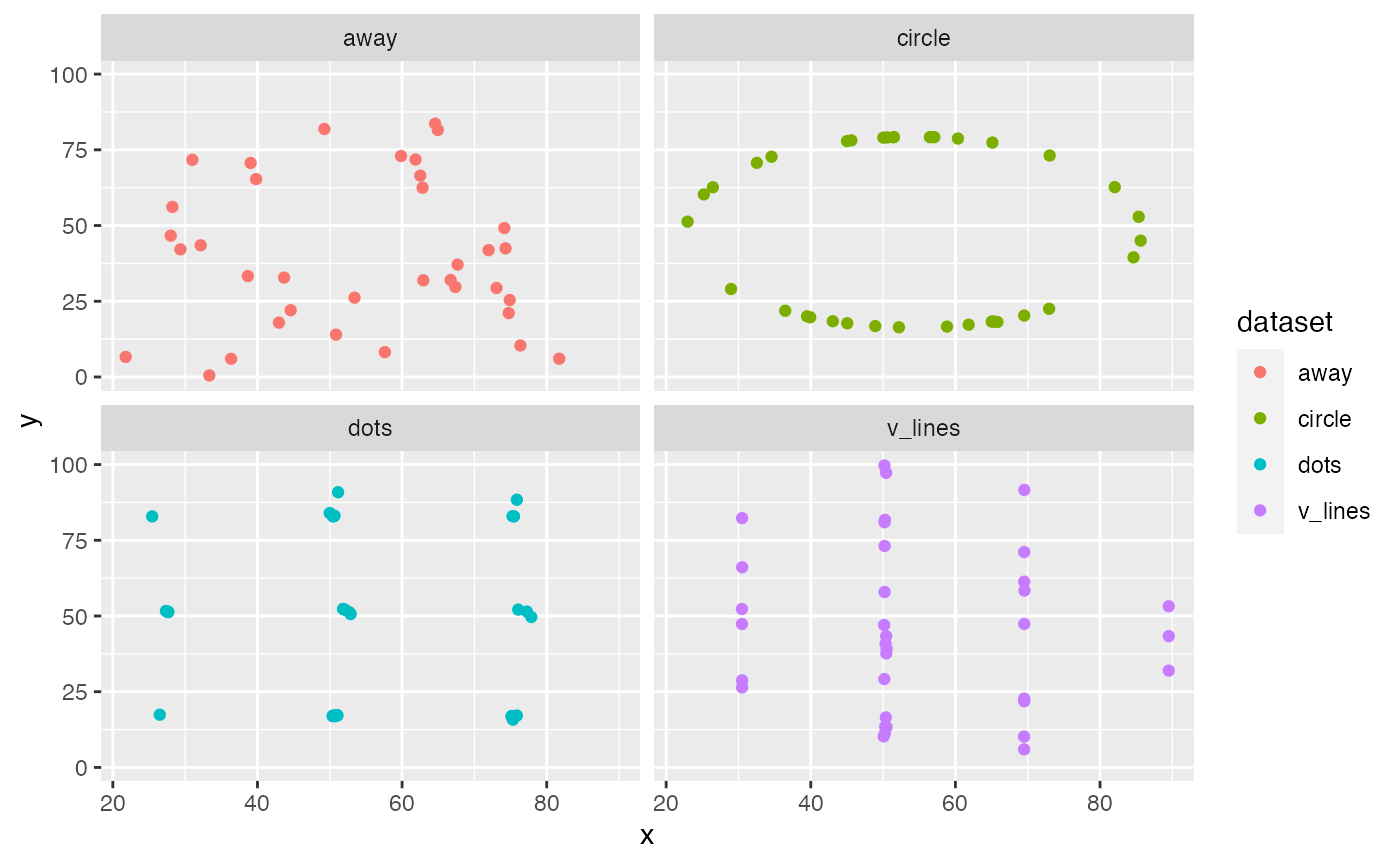
Scagnostics examples
#compute scagnostics
exampledata %>%
  group_by(dataset) %>%
  summarise(monotonic=sc_monotonic(x,y),
            dcor=sc_dcor(x,y),
            splines=sc_splines(x,y),
            skinny = sc_skinny(x,y),
            convex = sc_convex(x,y),
            striated = sc_striated(x,y),
            stringy = sc_stringy(x,y),
            ) %>%
knitr::kable(digits=4, align="c")| dataset | monotonic | dcor | splines | skinny | convex | striated | stringy |
|---|---|---|---|---|---|---|---|
| away | 0.0875 | 0.2417 | 0.1846 | 0.1821 | 0.8561 | 0.3333 | 0.8276 |
| circle | 0.0499 | 0.2597 | 0.1567 | 0.8383 | 0.0003 | 0.8611 | 1.0000 |
| dots | 0.0391 | 0.1570 | 0.3024 | 0.1338 | 0.9203 | 0.3333 | 0.8276 |
| v_lines | 0.0801 | 0.1757 | 0.0083 | 0.0868 | 0.9292 | 0.5714 | 0.7778 |