(Taken from tourr git repo) Compares the variance in residuals of a fitted spline model to the overall variance to find functional dependence in 2D projections of the data.
sc_splines(x, y)Arguments
| x | numeric vector |
|---|---|
| y | numeric vector |
Examples
require(ggplot2)
require(tidyr)
require(dplyr)
data(anscombe)
anscombe_tidy <- anscombe %>%
pivot_longer(cols = everything(),
names_to = c(".value", "set"),
names_pattern = "(.)(.)")
ggplot(anscombe_tidy, aes(x=x, y=y)) +
geom_point() +
facet_wrap(~set, ncol=2, scales = "free")
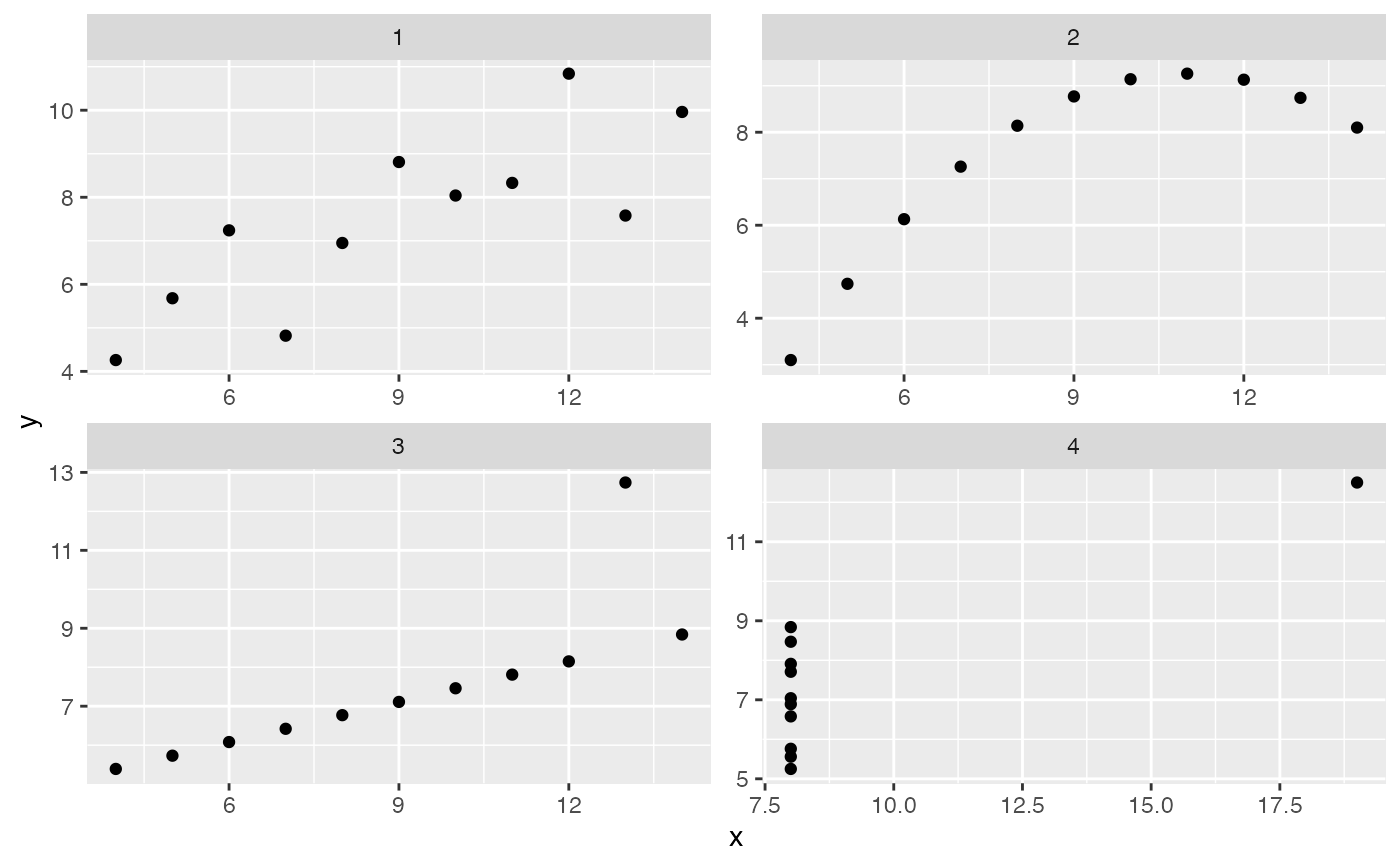 sc_splines(anscombe$x1, anscombe$y1)
#> [1] 0.6665425
sc_splines(anscombe$x2, anscombe$y2)
#> [1] 0.9977623
sc_splines(anscombe$x3, anscombe$y3)
#> [1] 0.9771846
sc_splines(anscombe$x1, anscombe$y1)
#> [1] 0.6665425
sc_splines(anscombe$x2, anscombe$y2)
#> [1] 0.9977623
sc_splines(anscombe$x3, anscombe$y3)
#> [1] 0.9771846