Compute angle adjusted striated measure using MST
sc_striated2(x, y)

# S3 method for default
sc_striated2(x, y)

# S3 method for scree
sc_striated2(x, y = NULL)

# S3 method for igraph
sc_striated2(x, y)
Arguments
- x
numeric vector of x values, or an MST object
- y
numeric vector of y values, or a scree object
Value
A "numeric" object that gives the plot's striated2 score.
Examples
require(ggplot2)
require(dplyr)
ggplot(features, aes(x=x, y=y)) +
geom_point() +
facet_wrap(~feature, ncol = 5, scales = "free")
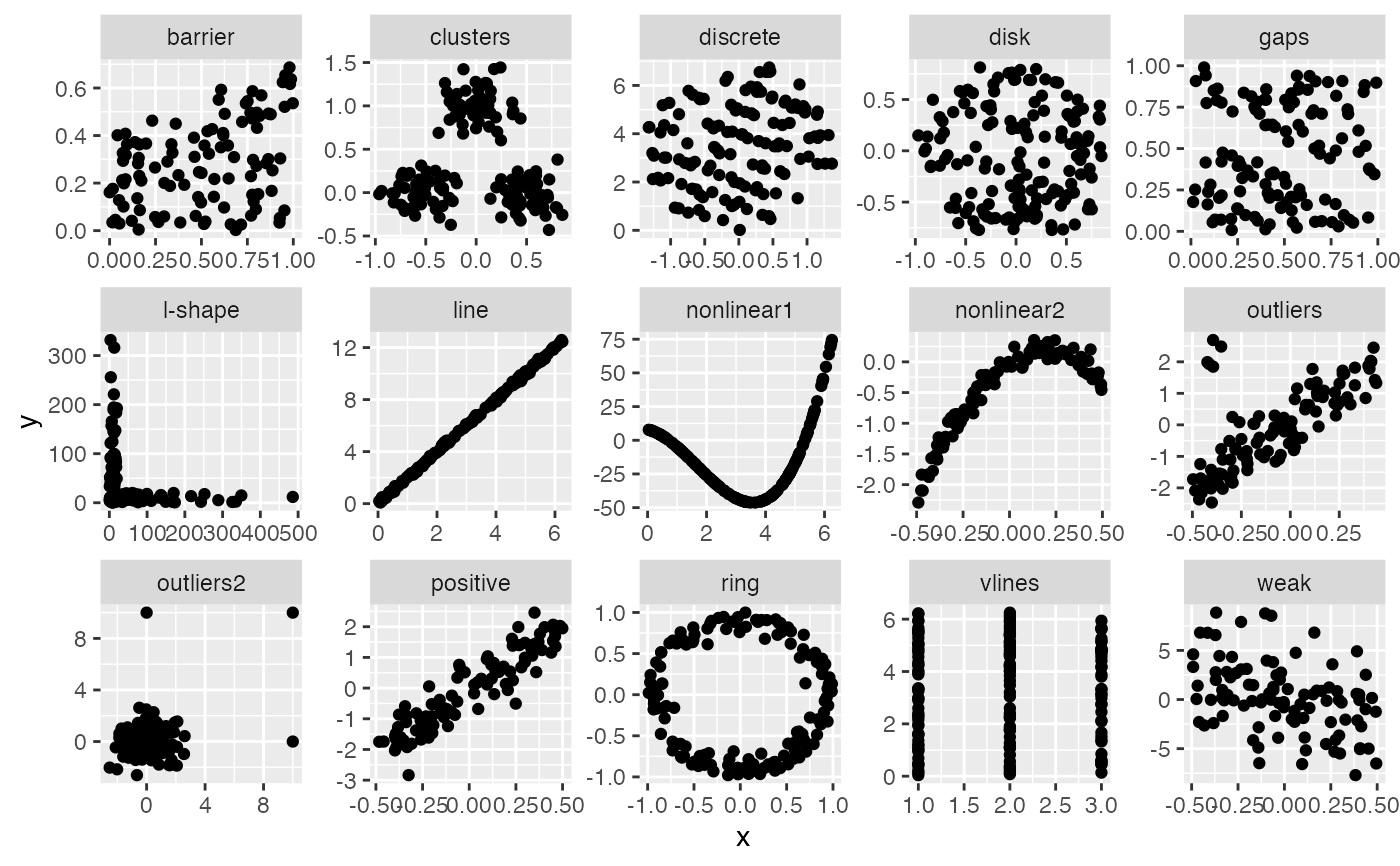 features %>% group_by(feature) %>% summarise(striated = sc_striated2(x,y))
#> # A tibble: 15 × 2
#> feature striated
#> <chr> <dbl>
#> 1 barrier 0.0588
#> 2 clusters 0.0878
#> 3 discrete 0.108
#> 4 disk 0.108
#> 5 gaps 0.075
#> 6 l-shape 0.0612
#> 7 line 0.0878
#> 8 nonlinear1 0.986
#> 9 nonlinear2 0.0816
#> 10 outliers 0.0971
#> 11 outliers2 0.0541
#> 12 positive 0.0714
#> 13 ring 0.0676
#> 14 vlines 1
#> 15 weak 0.0510
sc_striated2(datasaurus_dozen_wide$away_x, datasaurus_dozen_wide$away_y)
#> [1] 0.06428571
features %>% group_by(feature) %>% summarise(striated = sc_striated2(x,y))
#> # A tibble: 15 × 2
#> feature striated
#> <chr> <dbl>
#> 1 barrier 0.0588
#> 2 clusters 0.0878
#> 3 discrete 0.108
#> 4 disk 0.108
#> 5 gaps 0.075
#> 6 l-shape 0.0612
#> 7 line 0.0878
#> 8 nonlinear1 0.986
#> 9 nonlinear2 0.0816
#> 10 outliers 0.0971
#> 11 outliers2 0.0541
#> 12 positive 0.0714
#> 13 ring 0.0676
#> 14 vlines 1
#> 15 weak 0.0510
sc_striated2(datasaurus_dozen_wide$away_x, datasaurus_dozen_wide$away_y)
#> [1] 0.06428571