Compute skewed scagnostic measure using MST
sc_skewed(x, y)

# S3 method for default
sc_skewed(x, y)

# S3 method for scree
sc_skewed(x, y = NULL)

# S3 method for igraph
sc_skewed(x, y)
Arguments
- x
numeric vector of x values
- y
numeric vector of y values
Value
A "numeric" object that gives the plot's skewed score.
Examples
  require(ggplot2)
  require(tidyr)
  require(dplyr)
  data(anscombe_tidy)
  ggplot(datasaurus_dozen, aes(x=x, y=y)) +
    geom_point() +
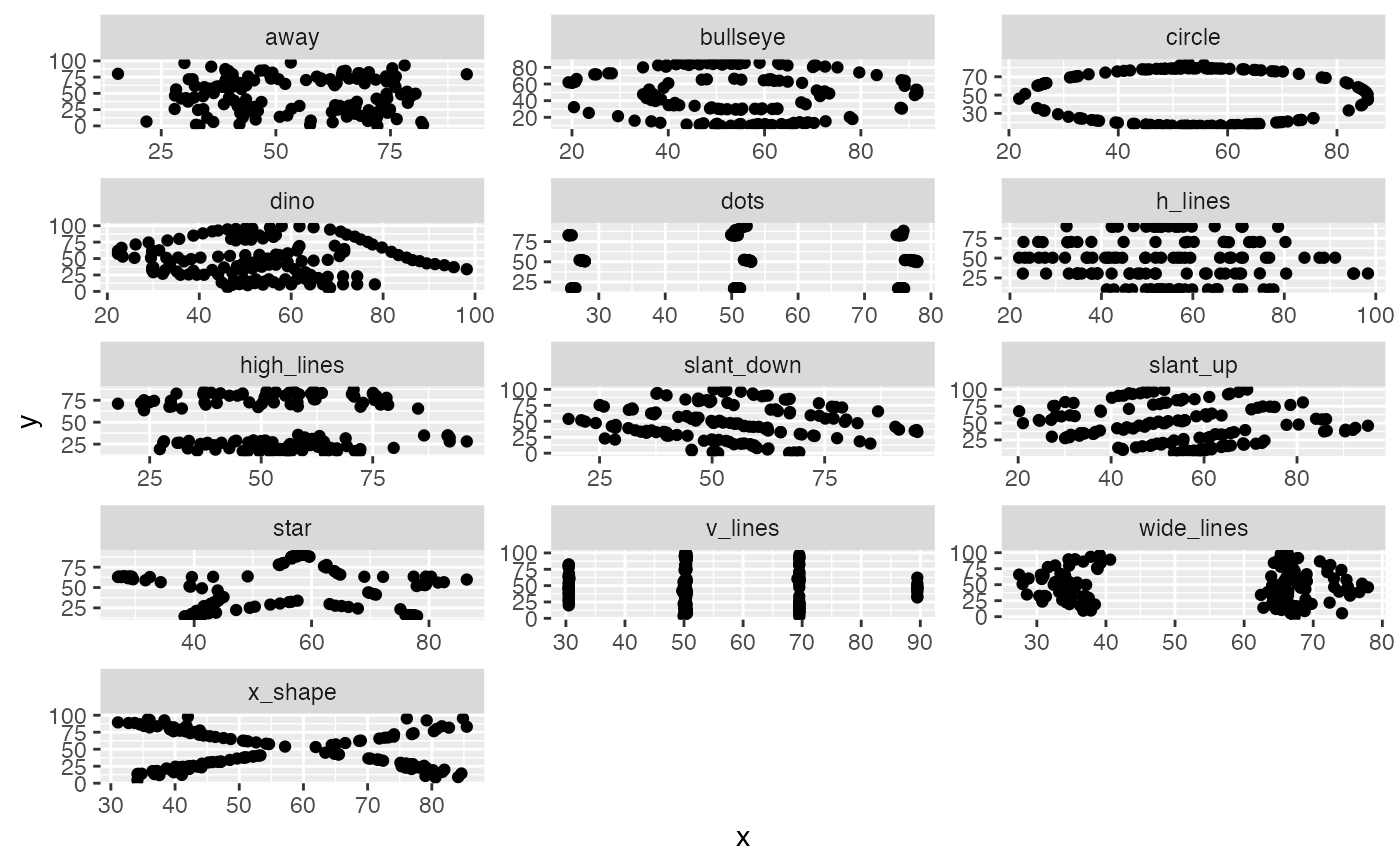
    facet_wrap(~dataset, ncol=3, scales = "free")

  sc_skewed(datasaurus_dozen_wide$dots_x, datasaurus_dozen_wide$dots_y)
#> [1] 0.858755
  sc_skewed(datasaurus_dozen_wide$h_lines_x, datasaurus_dozen_wide$h_lines_y)
#> [1] 0.7918524
  sc_skewed(datasaurus_dozen_wide$x_shape_x, datasaurus_dozen_wide$x_shape_y)
#> [1] 0.723502