Compute clumpy scagnostic measure using MST
sc_clumpy(x, y)

# S3 method for default
sc_clumpy(x, y)

# S3 method for scree
sc_clumpy(x, y = NULL)

# S3 method for igraph
sc_clumpy(x, y)
Arguments
- x
numeric vector of x values
- y
numeric vector of y values
Value
A "numeric" object that gives the plot's clumpy score.
Examples
require(ggplot2)
require(dplyr)
ggplot(features, aes(x=x, y=y)) +
geom_point() +
facet_wrap(~feature, ncol = 5, scales = "free")
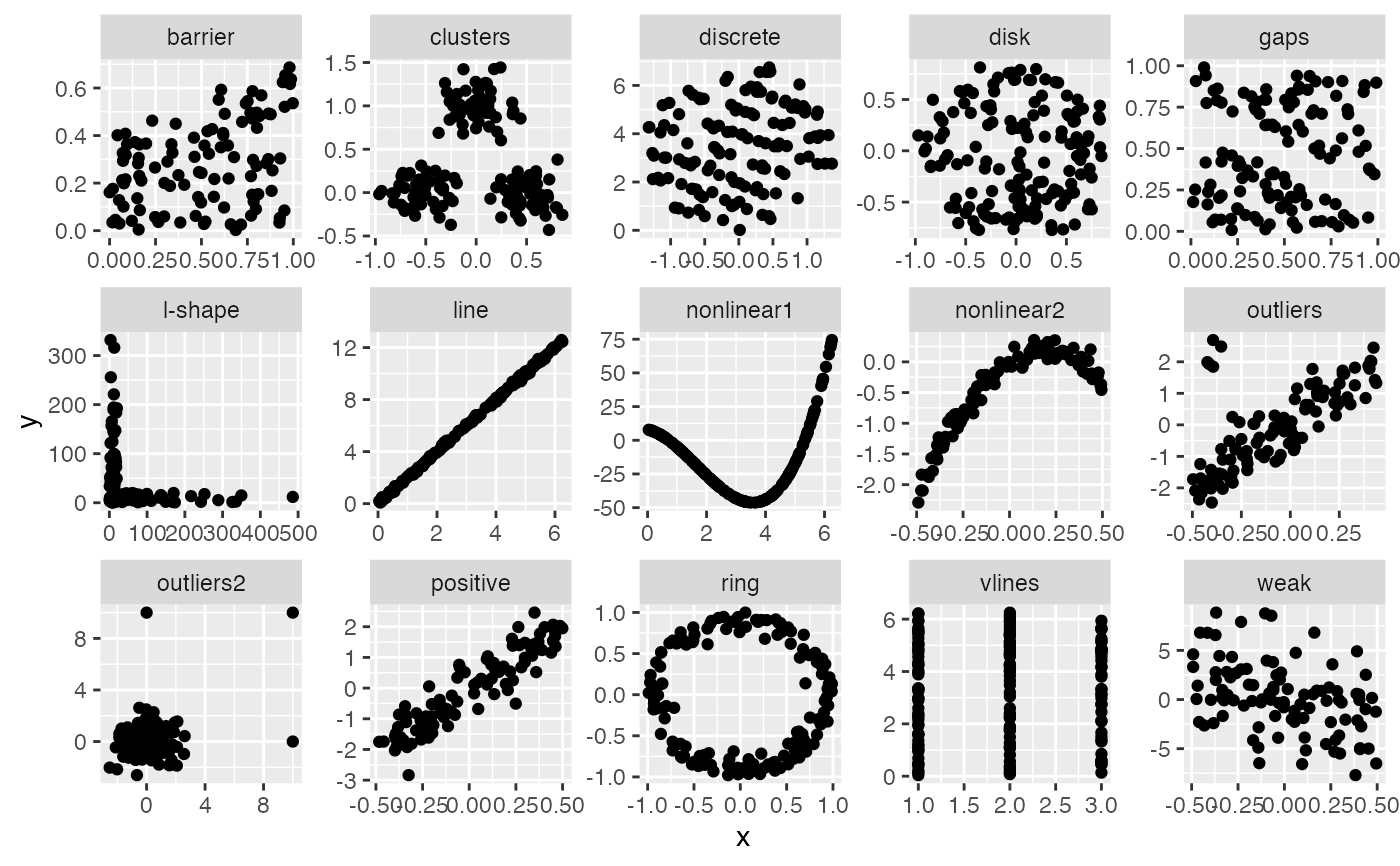 features %>% group_by(feature) %>% summarise(clumpy = sc_clumpy(x,y))
#> # A tibble: 15 × 2
#> feature clumpy
#> <chr> <dbl>
#> 1 barrier 0.810
#> 2 clusters 0.802
#> 3 discrete 0.949
#> 4 disk 0.913
#> 5 gaps 0.908
#> 6 l-shape 0.869
#> 7 line 0.870
#> 8 nonlinear1 0.988
#> 9 nonlinear2 0.742
#> 10 outliers 0.866
#> 11 outliers2 0.960
#> 12 positive 0.798
#> 13 ring 0.929
#> 14 vlines 0.907
#> 15 weak 0.760
sc_clumpy(datasaurus_dozen_wide$away_x, datasaurus_dozen_wide$away_y)
#> [1] 0.8834582
features %>% group_by(feature) %>% summarise(clumpy = sc_clumpy(x,y))
#> # A tibble: 15 × 2
#> feature clumpy
#> <chr> <dbl>
#> 1 barrier 0.810
#> 2 clusters 0.802
#> 3 discrete 0.949
#> 4 disk 0.913
#> 5 gaps 0.908
#> 6 l-shape 0.869
#> 7 line 0.870
#> 8 nonlinear1 0.988
#> 9 nonlinear2 0.742
#> 10 outliers 0.866
#> 11 outliers2 0.960
#> 12 positive 0.798
#> 13 ring 0.929
#> 14 vlines 0.907
#> 15 weak 0.760
sc_clumpy(datasaurus_dozen_wide$away_x, datasaurus_dozen_wide$away_y)
#> [1] 0.8834582