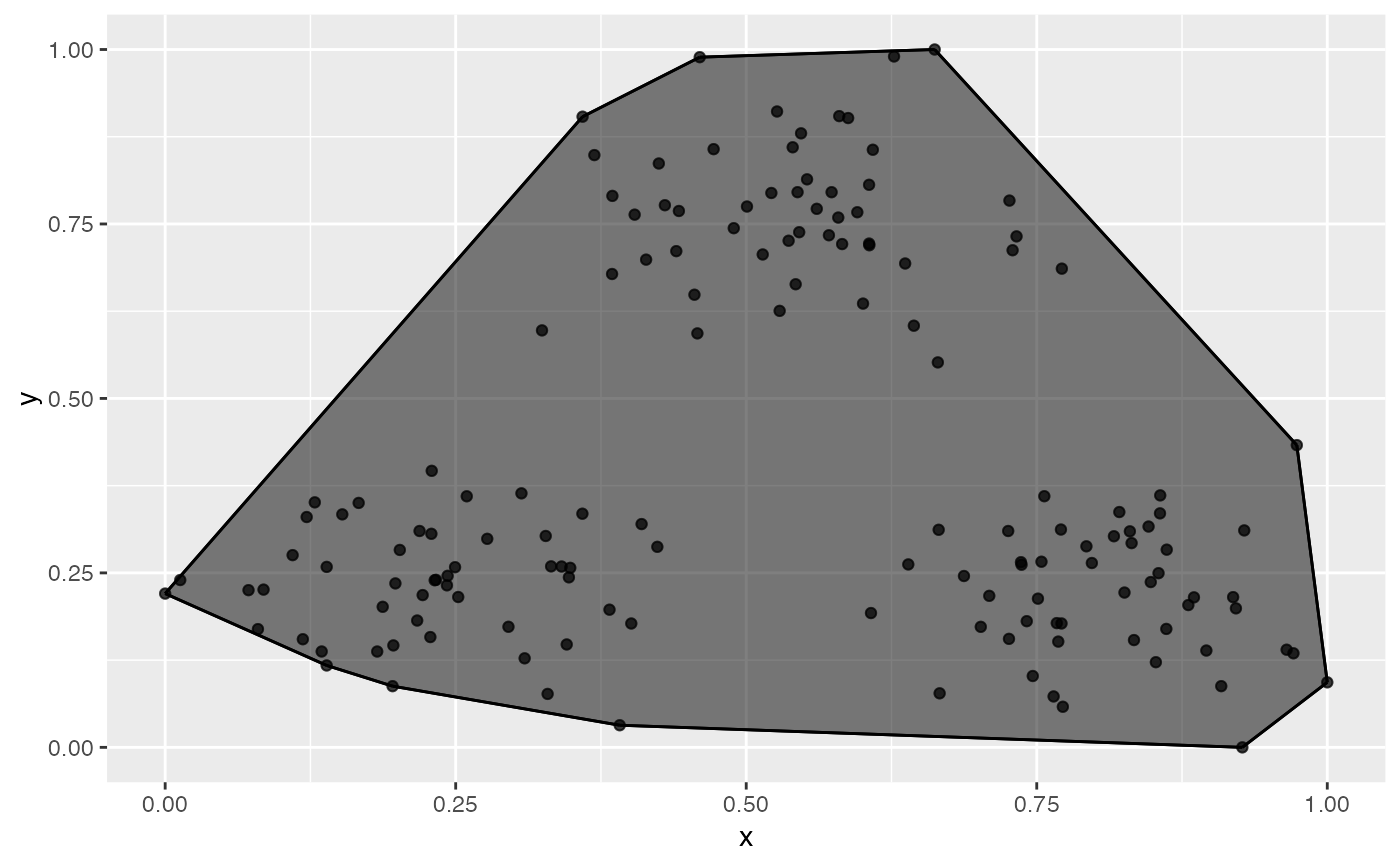
This function will draw the Convex Hull for a scatterplot.
draw_convexhull(x, y, alpha = 0.5, clr = "black", fill = FALSE, out.rm = TRUE)Arguments
- x
numeric vector
- y
numeric vector
- alpha
transparency value of points
- clr
optional colour of points and lines, default black
- fill
Fill the polygon
- out.rm
option to return the outlier removed convex hull
Value
A "gg" object that draws the plot's convex hull.
